As an SEO expert, it is important to consider the traffic quality of your website, this helps any online business to succeed. Traffic plays a vital role in improving all the important metrics of an SEO developed website. For example, if your page or blog have 100 visitors per month with a conversion rate of 1% by generating two leads. If you improve the quality of your traffic by 200, then the conversion rate will be 4%, and leads will be increased by 8. This is the reason why the quality of your website traffic matters. It is possible by analysing the traffic of your website, it is not advisable to use third-party tools for a Google ranking website, so we can use Google Analytics to measure your traffic growth and analyse your website. In this article, we will discuss, how to analyse your website traffic quality using Google Analytics.
How do you measure the quality of your organic traffic using Google Analytics?
I hope that you all know, how to integrate your WordPress site with Google Analytics, many beginners will be confused about the different parameters in this tool. This blog is to analyse your website traffic quality, here you should consider 3 important metrics,
1. Engagement Metrics – Time on Site, Page per Session, Exit Rate
2. Conversion Metrics – Conversion rate, Form submissions, other goal completion
3. Relevance Metrics – Bounce Rate, User Geo Location, New and Returning Visitors
These are the important factors to analyse the traffic of your website when you have the Universal Analytics integration and data. If you are a beginner, you cannot use this universal analytics facility embedded in Google Analytics 4 (GA-4). Here, we are using only the reports of Google Analytics to screen the traffic quality, and now we can explore all the terms and properties in the new GA4. After adding your property, your GA4 homepage will look like this,
Here you can see different tabs like Report Snapshot, Realtime, Lifecycle, and User. These are the 4 important options, and you can analyse the entire data of your site with these options.
1. Report Snapshot
Report Snapshot is the first tab in GA4 where you can see the overview of your website analysis. All the other tabs will be embedded in this page as dialogue boxes, and you can switch to another tab on this first page itself.
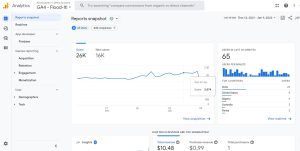
The main purpose of this page is to display the short view of your website, a graph will be displayed with the properties like Users, New users, Average Engagement Time, and Total Revenue and the graph will be shown for a selected period.
User
Number of users who visited and interacted with your website for a selected period
New Users
Number of new users who visited your website for a particular period
Average Engagement Time
It is the time per active user for a selected period
Total Revenue
Total revenue is the sum of purchase revenue, subscription revenue, and advertising revenue.
Here, you can compare your current analytics data with the past data, which is helpful to analyse the subsequent increase or decrease in user activities.
For this you need to activate the Compare option in the selected period of time, and also you need to select which of the data you need to compare. After selected click on Apply which will create a comparison report between the two selected periods.
You can also see the Users in the Last 30 minutes which is displayed on the same page, which is the short dialogue box of Realtime.
2. Realtime
In this section, you can screen the number of users engaged in your website. All the data will be displayed for the last 30 minutes which is the fresh Real-time report analysis. You can also the location of the users who access your site, and the device used by the user, it will be mentioned clearly that it is a desktop or a mobile device.

Here, you can also see that which page is viewed by most of the users, it will be displayed with the graph and page or blog title.
3. Lifecycle
In this section, you can screen the Acquisition, Engagement, Monetization, and Retention of your website.
Acquisition
This section has 3 subsections, which are Acquisition overview, User Acquisition, and Traffic Acquisition.
Acquisition Overview
In this section, you can the number of active users and new users who interacted with your website for a selected period.

User Acquisition
In this section, you can see the number of users visited your website or interacting with your website currently. The graph will be displayed for the number of users from organic search, from referrals, and the users are directed from other sites without any source (none).
With this graphical representation, you can analyse the number of users visiting your site through organic search and referrals. A table will be displayed below with the count of new users, engagement session, engagement rate, and average engagement time of a user.
Traffic Acquisition
This is the important section to be analysed, that it gives the information about the traffic of your website. Where your website is acquiring traffic, and the graph will be shown with traffic growth from organic (google), direct, organic (Microsoft bing), organic (Baidu) with this information you can see the quality of your website traffic and how many authorized sites are referring your website.
You can also see a table that has the list of users, sessions, engaging sessions, average engagement time, engagement rate etc, where the data will be the same as a graphical representation.
Engagement
The section contains 4 sub-sections namely, engagement overview, events, conversions, pages, and screens.
Engagement Overview
In this section, you can analyse the data about average engagement time, engaged session per user, and average engagement time per user and the data will be displayed in a Graphical representation.

Pages and Screens
In this section, you can analyse which pages of your website are visited more by a greater number of users. This will be displayed in both graph and table.
Monetization
Monetization helps you to analyse the sales and service of your products and brands. This is useful for all the business websites to analyse the products which are sold higher, and which are not sold for many days.
4. User
In this section, you can see tabs Demographics and Tech
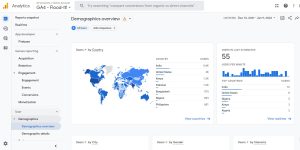
Demographics
This tab has two dub tabs Demographics overview and details; both represent the same data but in different ways. In this section, you can see the entire information of the users, i.e., their country, city, gender, age, language, and interests. With this, you can focus on the targeted audience to publish any of the new content with the appropriate keyword.
Tech
This also contains two subsections, and both are representing the same data in different ways. In this section, you can see the technical details like the device used by the user, OS, browser, and even the screen resolution of the user’s device.
Final Note
Above listed are some of the analytics data that are commonly screened. With this information you can optimize your website and content according to the user needs, you can select your targeted audience based on their interests. As an SEO expert, it is important to know about these analytics data to improve your website traffic.